Production tracking software

Maximise throughput. Minimise idle time.

Transform raw machine data into actionable insights. Identify bottlenecks, optimise cycle times, and increase your factory’s overall output without adding new equipment.
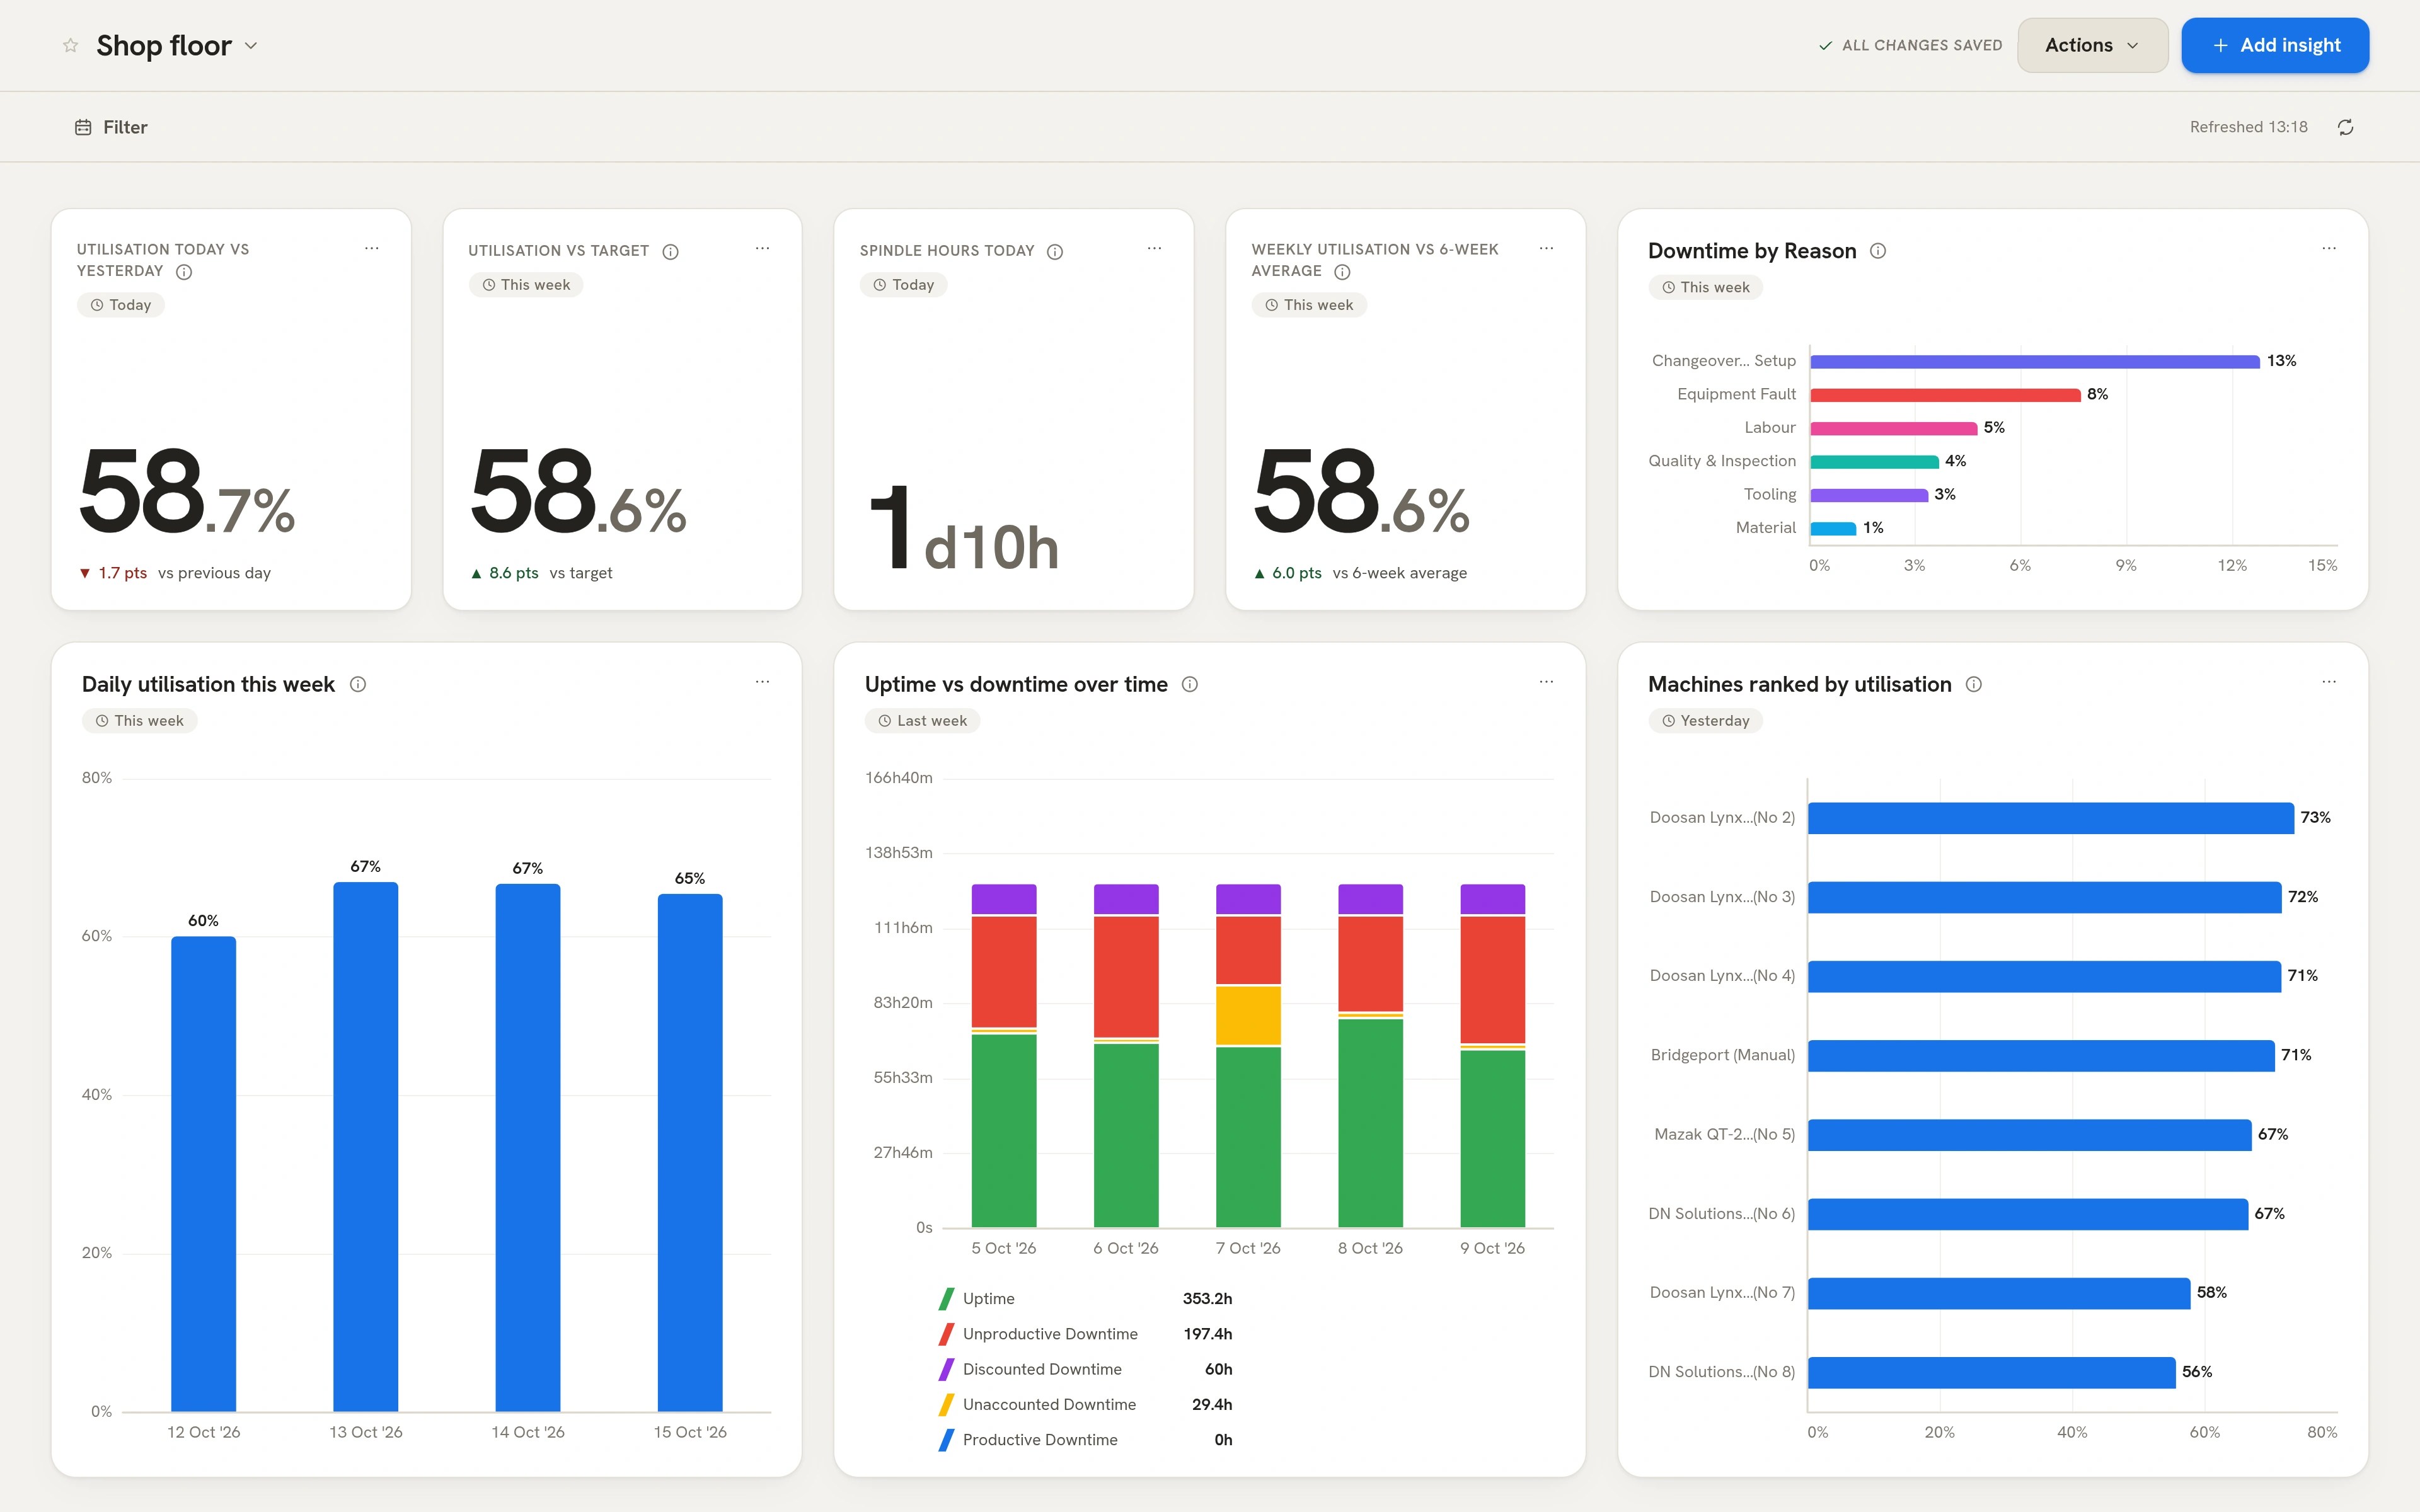
The TrackMyMachines shop floor dashboard: utilisation, spindle hours and downtime by reason for every machine

Features built to stop guessing and start earning.

High-performance manufacturing requires a deep understanding of how your machines spend every second. Our features bridge the gap between raw signals and the strategic decisions that drive throughput and protect your margins.

By centralising utilisation data, downtime tracking and job analysis, we provide the tools to eliminate operational friction. These features give you the granular control needed to resolve recurring bottlenecks and maximise capacity across your entire floor.

“In the first week we’ve measured cycle times for the first time on components we’ve been making for 50 years.”

Jim Young Production Manager, Irco Redditch

Operations Timeline

Track factory floor activity down to the second.

Zoom out to analyse shift-wide utilisation, or zoom in for granular, second-by-second cycle data.
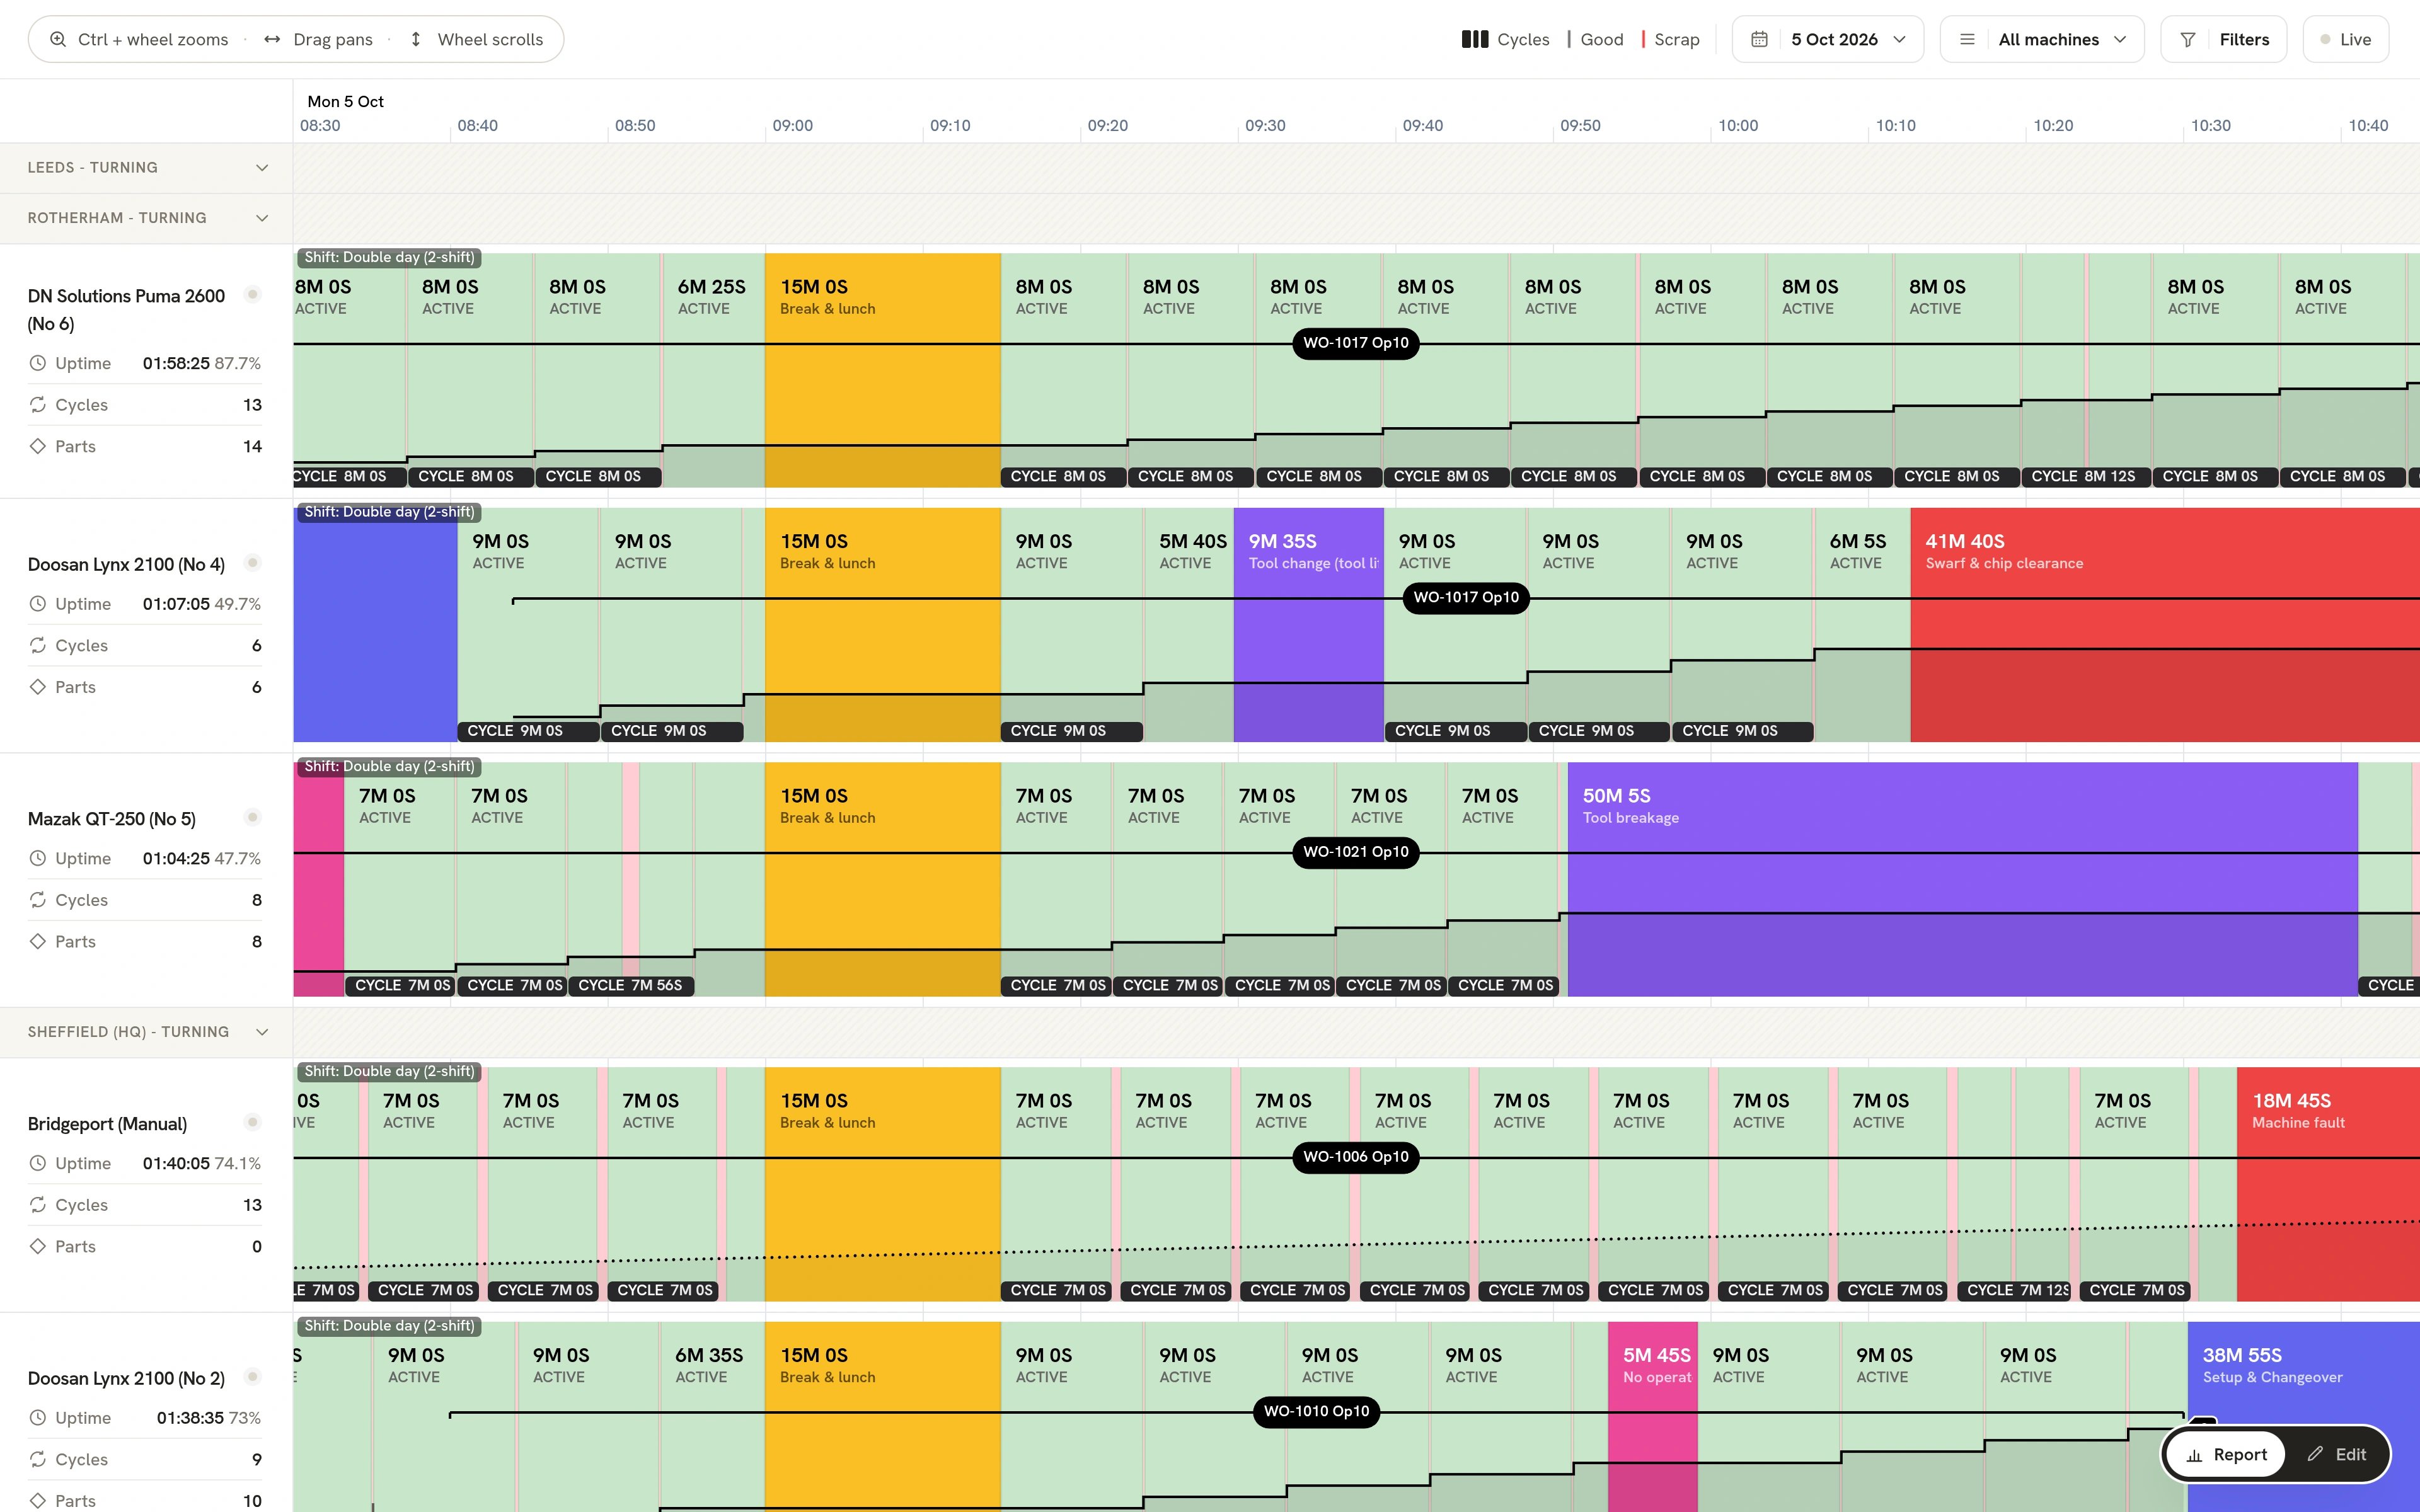
The Operations Timeline: every machine through the morning, each cycle, the running work order and every stop with its reason
  1. Downtime attribution

    Identify exactly why production paused with reasons overlaid directly on your timeline.

  2. Precision cycle analysis

    Visualise every single machine cycle to identify opportunities for optimisation.

  3. Live part and scrap tracking

    Correlate machine activity with real-time yields.

  4. Operation-level context

    See precisely which job or operation was running at any given moment.

  5. Go back in time

    Uncover the reasons why a job was late, a part was scrapped or the root cause of any operational incident.

Custom dashboards

Your numbers, the way you want to see them.

Build your own dashboards from KPI cards for OEE, utilisation and more. Every card runs on live data from the shop floor, so the figures are always current.

A custom dashboard close up: KPI cards for utilisation today, utilisation against target, spindle hours and weekly utilisation, above charts of daily utilisation and uptime against downtime
  1. KPI cards

    Add cards for OEE, utilisation and the other measures you track.

  2. Filter to what matters

    Set each card by shift, period, factory, line or machine.

  3. Arrange it your way

    Reorder and resize the cards until the dashboard reads the way you work.

  4. Share and schedule

    Share a dashboard with your team, save it as a PDF, or have it emailed to you every day.

  5. Always live

    No refreshing and no exports to update: the cards fill themselves.

TV panels

See which machines need you, from across the floor.

Put a live view of production on any TV. It shows which machines are running, which have stopped and what job each one is on, so everyone on the floor knows where to go next.
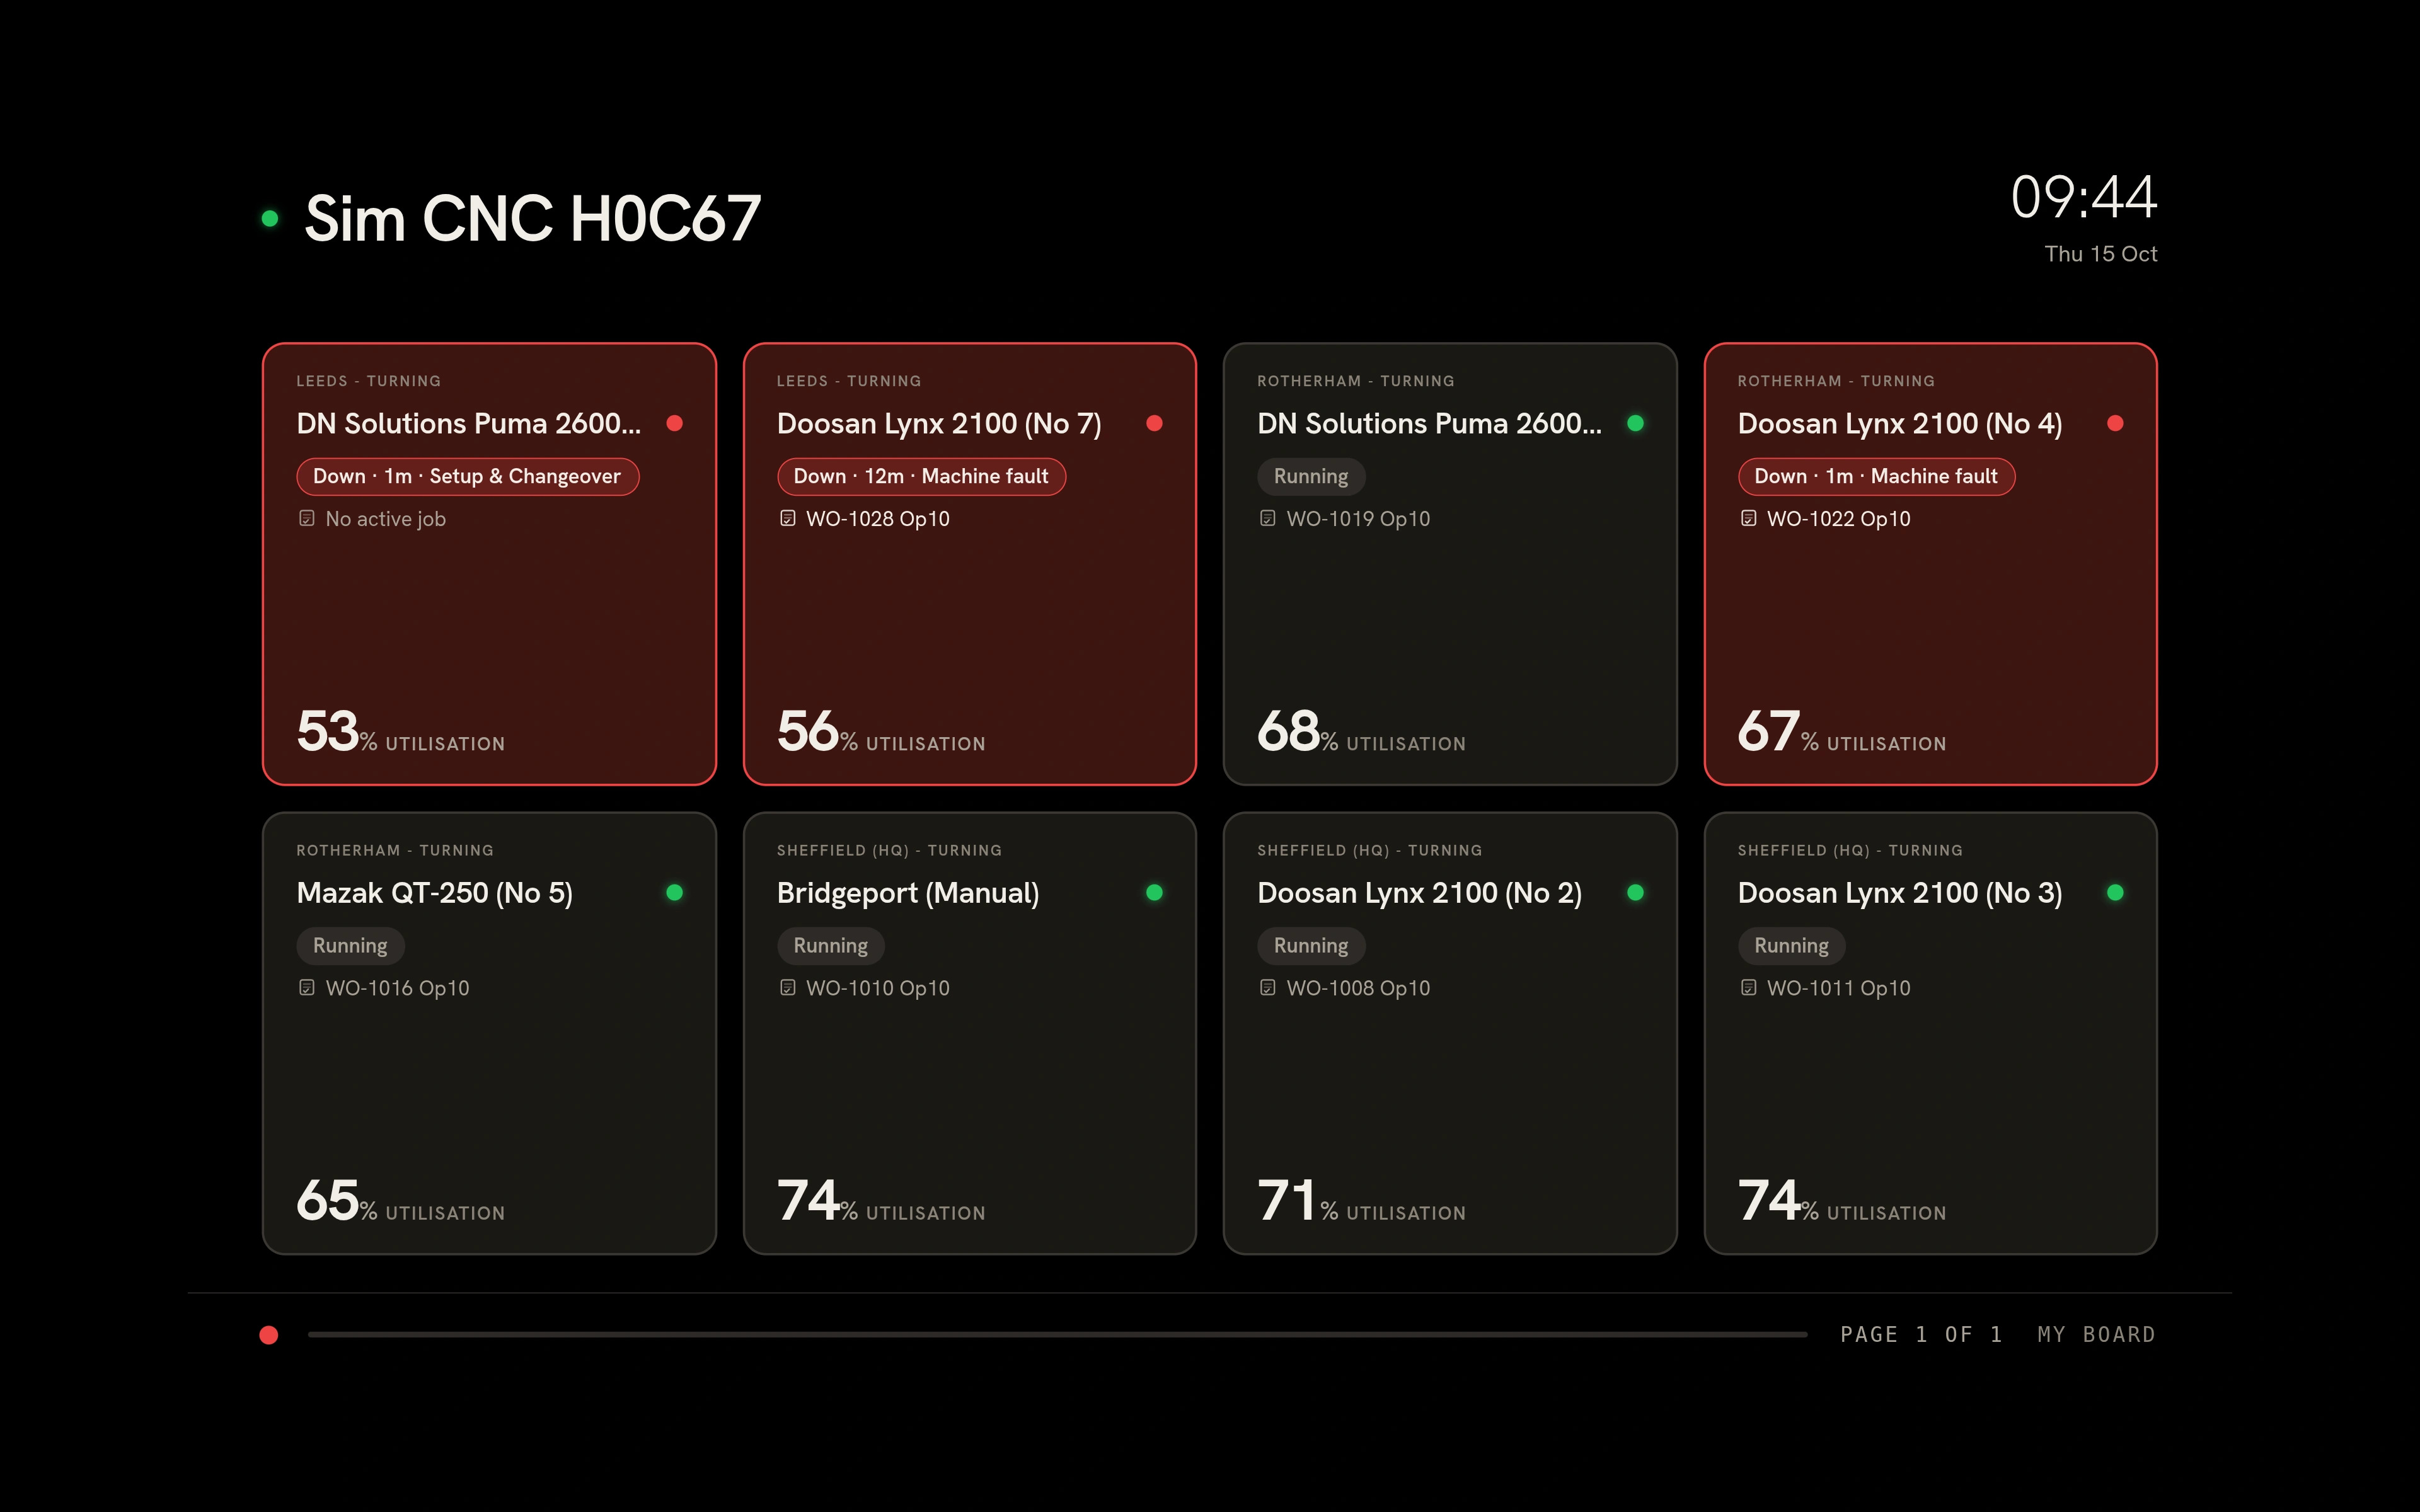
A TV panel: eight machines, each showing whether it is running or down, the reason for a stop, its current job and its utilisation
  1. Connect with a QR code

    Scan the code on the screen and the TV signs in to its live view. No setup on the TV itself.

  2. Up, down and on which job

    Every machine shows its state and its current job, live.

  3. Alerts that wait for a real problem

    Set a threshold for each alert, and a machine only turns red once it has been stopped that long.

  4. As many TVs as you like

    Unlimited screens: one between two machines, one per cell, or one for the whole factory.

  5. Set it up your way

    Choose which machines and details each screen shows.

Operator Panel

Give your operators the full picture, right at the machine.

A tablet at the machine lets operators run their jobs and record what happened. The reasons behind every number come from the people who were there.
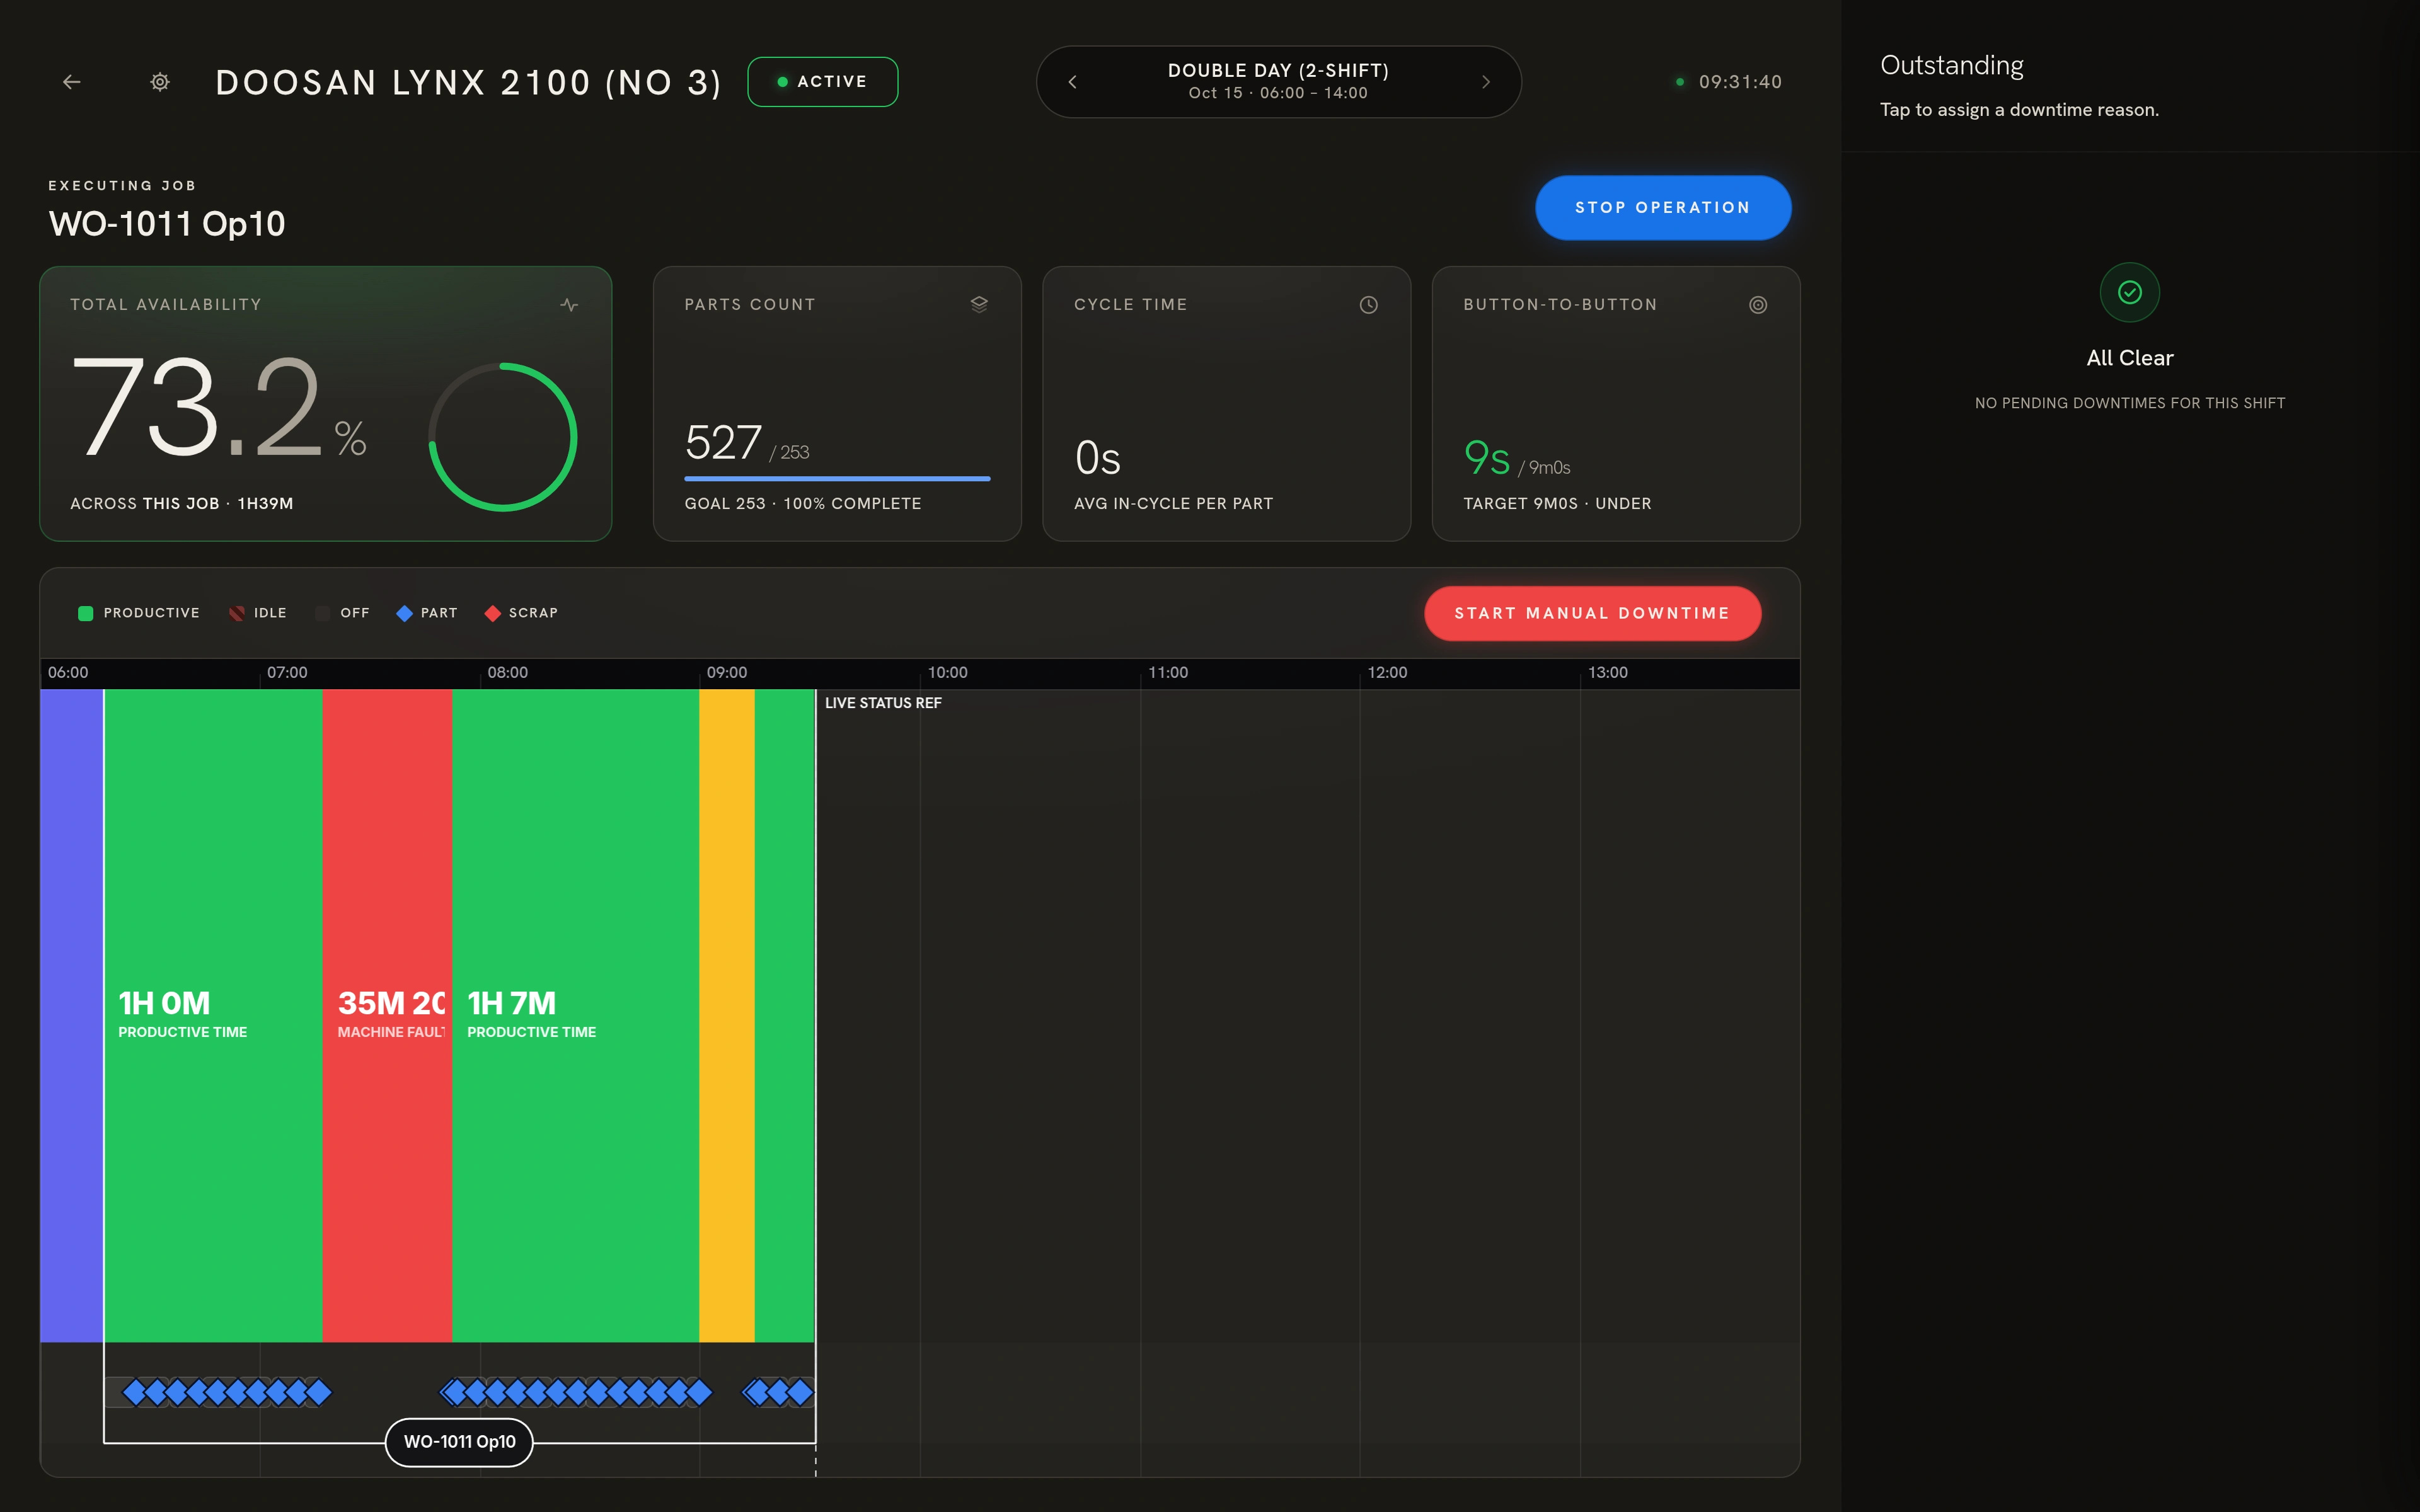
The Operator Panel at a machine: the running job, availability, part count, cycle time and the shift so far
  1. Start and run operations

    Operators start each operation from the tablet beside the machine.

  2. Downtime reasons, prompted

    When our hardware detects a stop, the panel asks for the reason, so stops don't go unexplained.

  3. Scrap at the source

    Log scrap as it happens, against the right job.

  4. Cycles and counts they can see

    Operators see their cycles and the part count, counted automatically from the machine.

  5. Manual counts when they need them

    Add a manual part count for anything the machine can't count.

What you can track

Everything your machines can tell you, tracked.

A clamp on the power cable gives you the core numbers. Link the machine's control as well and you add its alarms, programs and setup times.

Utilisation

How long each machine really runs, hour by hour.

Downtime and its reasons

Every stop, with the reason from the operator who was there.

Cycles and cycle times

Every cycle detected automatically, with live cycle times against target.

Part counts

Parts counted from the machine, with manual counts where it can't.

Scrap

Scrap logged at the machine, against the right job.

OEE

Availability, performance and quality, worked out for you.

Energy

Power use by machine, including what each one draws while it sits idle.

Alarm codes

Alarm codes as they happen, with their history.

Programs and tools

The program and the tool behind every run.

Work order progress

Which job is running and how far through it is, live.

Setup times

Setup time captured automatically, job by job.

Shifts

How each shift compares, for any shift pattern you run.

AI assistant and API

Ask your data a question, or build on it.

Ask your AI assistant

Connect Claude, Microsoft Copilot or ChatGPT to TrackMyMachines with our MCP connector, then ask about your machines in plain English.

  • Utilisation, downtime, OEE, energy, parts and scrap, by site, cell or machine
  • Read only: it answers your questions and never changes your data
  • Included with TrackMyMachines at no extra cost

Build on the REST API

Pull your production data into your own systems, reports and apps through our open REST API. It comes with your TrackMyMachines plan.

  • Feed your ERP, your MES or Power BI with live machine data
  • Group it by site, cell, machine or shift pattern

Put your own machines on screen.

Book a demo and we'll show you what TrackMyMachines would show you on your floor: every machine, every stop and every part, as it happens.

Tiered pricing

Machinesper machine per month

  1. 1–4 machines£75
  2. 5–9 machines£61
  3. 10–24 machines£55 (the standard price)
  4. 25–49 machines£49
  5. 50–99 machines£44
  6. 100–199 machines£40
  7. 200+ machines£36

Hardware and connectivity included at every band.

Not sure of your fleet size? Pilot it on 3 machines for 3 months, £300.

Get in touch about a pilot

Pilot offer

£300for the whole pilot

Nothing to cut, fitted in under an hour. See your own data, then decide.

Start a pilot