Improving your productivity with Machine Monitoring
Thursday Oct 10, 2024
We’ve helped manufacturers just like you improve their productivity by 26% and reduce their costs by £20,000 per year. Our focus is on simple and easy process visibility.
If it’s your first time monitoring your machinery, it’s hard to know how to use your spindle uptime data to take action in your machine shop. Here’s some tips and methods to get you started.
Gardner Denver saved almost £20,000 a year by taking action with machine monitoring
Read the case studyMake live visualisations available to everyone
The first thing to do is make your Factory Overview visible for those affected by production (if you’re a manufacturer that’s everyone).
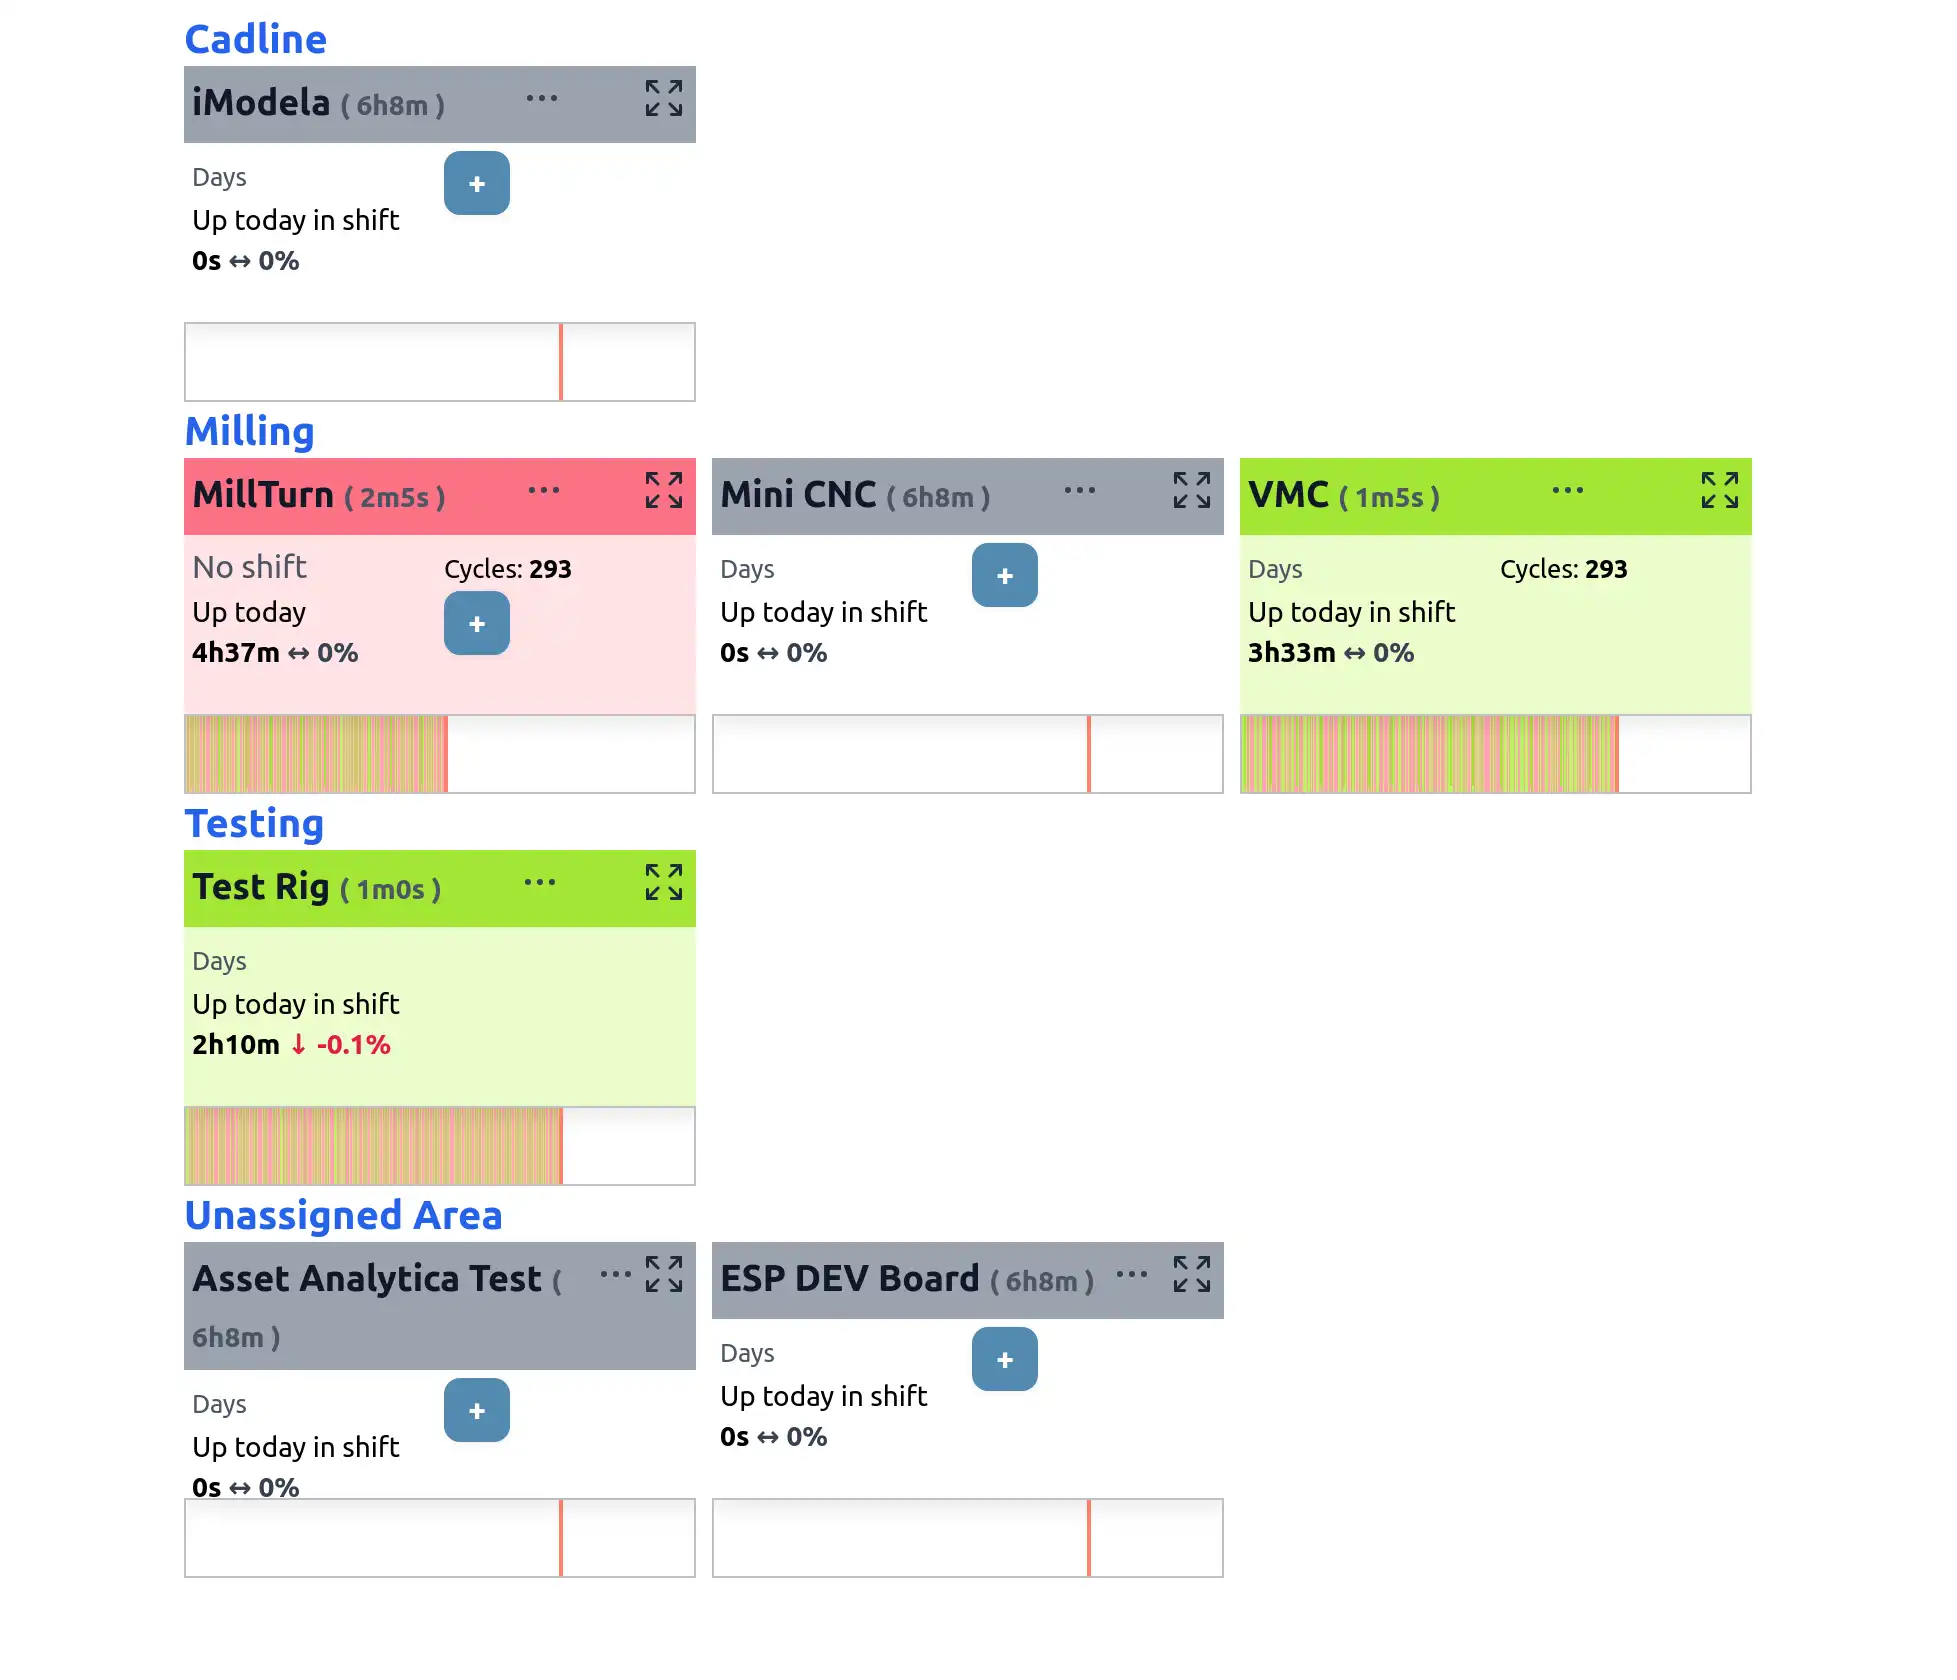
This shows staff what’s happening on the machine shop floor at any time. Meaning operators, production managers, process engineers and your internal sales staff can all see the same information. There’s a surprising social impact to this: when this kind of information is visible then people can take on a wider perspective of what’s going on and think more about the future than just the impulsive requirements of today.
For Operators, this means they might think more about setting up the night shift before their day’s work, making sure that the machinery can run for longer unmanned, maybe at the expense of not getting their own work through the doo rstraight away.
For Engineers, this might make them look at a machine they’ve known had a long setup time, and trigger them to do something about it. Maybe they’ll put together a case for new workholding or custom fixturing.
For Production Managers, this means they’ll be using the exact same information as the operators and machines they manage. This improves trust and respsect and reduces the chance of miscommunication.
When everyone’s looking at the same data they’ll see the motivational direct impact of their work. They’ll also feel more empowered to speak when backed up by the truth.
They'll feel more empowered to speak when backed up by the truth
Watch your production live and see things you didn’t before
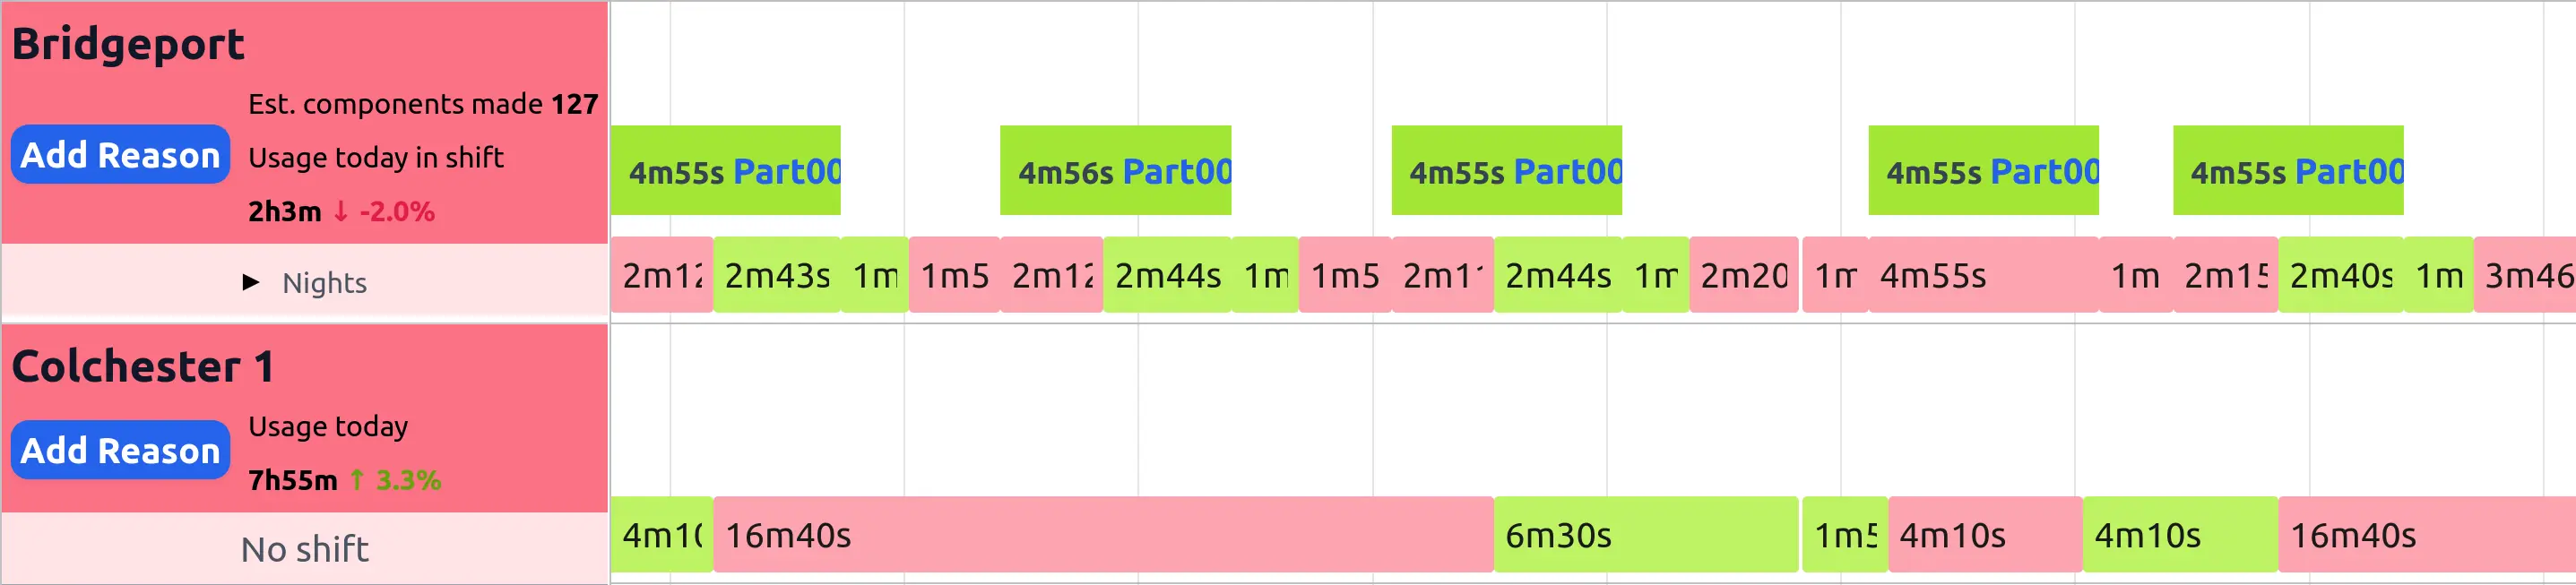
With the Timeline your whole factory’s live operations are visible. This is a completely new way to see your factory. Normally if you’d go down to the shop floor in the morning you take a mental snapshot of its state at that time. The flaw in this method is that a process is constantly changing, this means you need a way instead to visualise your whole processes. That’s how the timeline revolutionises how you see your production.
As a production engineer you probably already know what kind of jobs are running on your machinery and the dynamics between them. Machine shops are complicated systems: some machinery has cycle times less than a minute, and other jobs can last tens of hours.
When looking at the Timeline you can use this company-specific information to spot patterns that only you can make sense of. Things like watching a changeover reduce as operators get used to a component for large castings, or watching the night shift run those long-cycle components well into the next day can cement trust in your operations. Other times, watching machines left idle for hours waiting for first article inspection can be a frustrating experience, and shows clearly an operational bottleneck.
Identify processes that need investment
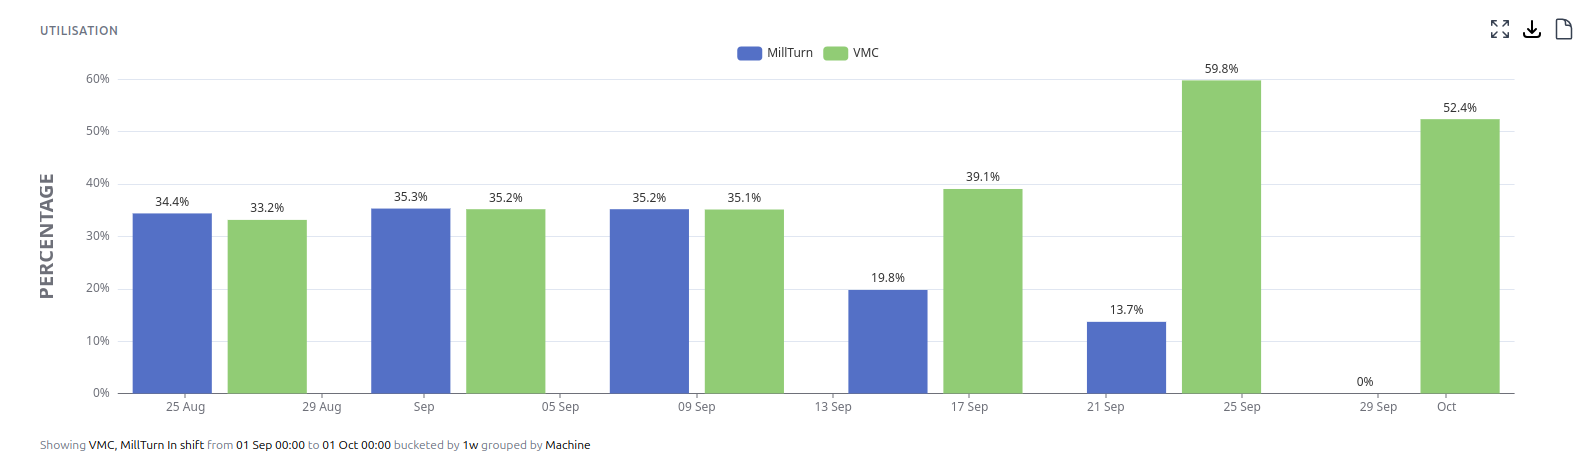
You can use the Charts functionality to visualise your historical uptime and downtime reason data in many ways, by Machine, Cell, Shift pattern over any time range. Use this to pinpoint times and machines that aren’t hitting the uptime that you want, right clicking on the information you’re interested in allows you to drill down into the data from a high-level view, ending at the Timeline showing the exact activity of the machines you’re interested in.
Take action
Only you know what your machinery does, the workholding and tooling you use and the exact production scheduling methods you implement.
The exact changes you should make are up to you and your staff, everyone is an important component of the production process, and should be able to recommend or take actions to help improve productivity.
If you’d like some inspiration, here’s a case study with exact examples of how Gardner Denver saved almost £20,000 per year with operational changes.
Test whether changes had positive impact
Once you’ve taken action, you can now use TMM machine monitoring reports to show whether your actions have improved your utilisation.