When a machine isn’t as efficient as it could be, it’s important to find out its main reasons for downtime. Doing a downtime analysis in the traditional way, a Kaizen Event, can be useful but will take precious time out of the production process.
Kaizen Events
Kaizen Events are that the whole organisation can take part in, where a particular machine or process is mapped out, with particular attention paid to each element of the process that doesn’t add value. In the case of CNC machining these “wastes” could result from:
- Process setup (Setting tool dimensions, putting together workholding, finding work order packs)
- Component changeover
- Manual process intervention (pulling out swarf from the machine)
- Operators running other machines
It’s hard to measure the impact of this downtime during a Kaizen event. To put a number on when these happen and how long they take would require someone to watch the process and make a manual note of their times and durations.
Machine monitoring and Downtime analysis
Instead, with an automated machine monitoring system like TrackMyMachines there’s already changeover and setup times measured all day every day. From the image below the cycles and changeover times for a given job are seen clearly. This is available 24/7 without any manual work, the TMM Machine monitoring hardware is working hard every day to gather this data for you.

Specific reasons for downtime
For more in-depth machine downtime reasons instead you can fit tablets or computer terminals to the shop floor. These can be used by the operators to input specific reasons the machines are down.

This requires human input, and it’s necessary to evaluate whether the extra work required by operators is worth the capturing of this specific information.
Once downtime reasons are captured you can start to analyse your machinery and find opportunities for improvement. Almost like a Kaizen event every day!
Downtime analysis with TrackMyMachines
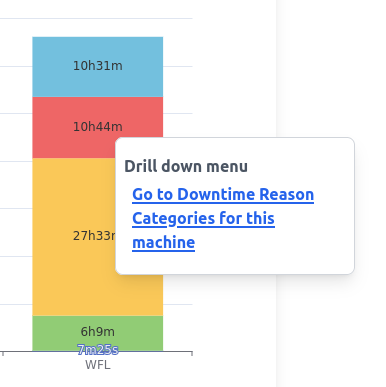
You can drill down into each machines’ downtime reason statistics from TrackMyMachines charting page. Looking at the Downtime Analysis chart grouped by machine, it’s possible to see the breakdown of machine downtime.

Drilling down by right-clicking the machine we’re interested in we can see the downtime reason categories, to see which part of the process might need improvement.


Drilling down even further we can see the exact downtime reasons and what duration they’ve been active for.


